Having just made homemade strawberry jam recently – I thought it timely to share this Fruit Equivalency Chart. It might be helpful if you are canning/preserving foods (aside: I love to buy fruit in season and make jam – that way we enjoy the taste all year!).

Fruit Equivalency Chart
For reference: I made 18 glass jars (16 standard size and 2 large mason jars) using one flat of strawberries. I cooked two batches at the same time (you can’t just double the recipe because it will mess up the set of the jam). So if you want to double batch, like I did, you have to cook two different batches following the same recipe at the same time. Sounds tricky but it’s actually pretty easy.
I don’t recommend making jam with kids (or as a family activity). For one thing…the sterilized jars from the oven are HOT. And so is the cooked jam. HOT things + kids = accident waiting to happen.
You could also use this fruit equivalency chart for…
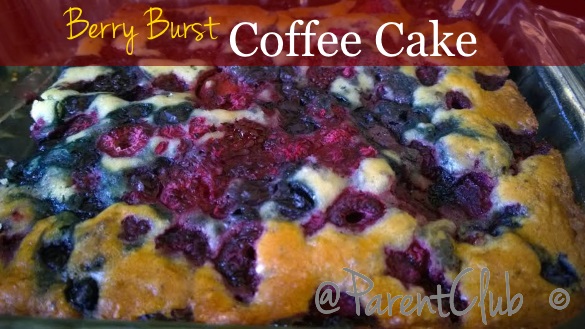
Just sayin’…that cake was good. 😉
This is so handy when making jam. I haven’t done any yet this year but I was thinking of doing a batch of peach jam. Thanks!
Helpful to know, thank you! I am going to try my hand at preserving for the FIRST time this year!
Try Jam Soozle – it’s really easy!
I admit: we are halfway through the strawberry jam double batch I made in late June.
My apples must be pretty small because I can not get 2 cups from 1 apple..that blueberry cake looks awesome!!
That is a very handy equivalency chart, thank you.
Thanks for the chart. I always end up staring at the fruit and scratching my head trying to figure it all out lol
This is really handy. I’m bookmarking this page. 🙂
This is handy, I am always guessing and estimating.
Thanks for the chart. I have to get making jam soon!
very helpful chart
September is my month foe canning/bottling and this chart will be so handy thanks
Thanks! This is useful!
I will be making Blueberry jam later the week this will be so useful